I've always had a passing interest in tracking satellites. For over 10 years I've had STSORBIT PLUS Space Shuttle and Satellite Tracking Software by David H. Ransom, Jr. installed on my computer to bring up once in a while, particularly during Space Shuttle missions. However, it's kind of antiquated and requires manual fetching of the current orbital data ("TLEs" or "2-Line Elements") to use it.
Similarly, in my earlier post on using XPlanet to generate current satellite wallpaper I discuss how to build a dynamic wallpaper which shows satellite tracking over the current earth image (with current cloud cover) but it also requires fetching the TLEs.
However, now it appears I can drop STSPLUS in favor of an Ajax enabled online version which has lots of nice features and utilizes Google maps for the mapping.
Wednesday, August 09, 2006
Tracking satellites
Wednesday, July 12, 2006
Get request parameters through JavaScript
This is not original content, I'm just a reciting information I found elsewhere (see original), but with more processing done on the client side in JavaScript for Ajax, it's sometimes necessary to be able to process parameters passed on the URL with JavaScript as you would with PHP, JSP, etc. on the server. So since I found a method to do it, I'm posting it here for my own benefit so I don't have to find it again. You can also download it here.
function getParameter ( queryString, parameterName ) {
   // Add "=" to the parameter name (i.e. parameterName=value)
   var parameterName = parameterName + "=";
   if ( queryString.length > 0 ) {
      // Find the beginning of the string
      begin = queryString.indexOf ( parameterName );
      // If the parameter name is not found, skip it, otherwise return the value
      if ( begin != -1 ) {
         // Add the length (integer) to the beginning
         begin += parameterName.length;
         // Multiple parameters are separated by the "&" sign
         end = queryString.indexOf ( "&" , begin );
      if ( end == -1 ) {
         end = queryString.length
      }
      // Return the string
      return unescape ( queryString.substring ( begin, end ) );
   }
   // Return "null" if no parameter has been found
   return "null";
   }
}
The
queryString is obtained via var queryString = window.top.location.search.substring(1);
Thursday, July 06, 2006
Follow up on inline SVG
This is just a brief follow-up to my previous request for help.
I had built my XSLT to render the SVG as described in the article, Render dynamic graphs in SVG and my mouseover coloring events was modeled after the article, Add interactivity to your SVG, which were both articles from developerWorks.
So, my generated code for a bar in my graph looked like:
<svg:rect x="35" y="272.88" height="57.12" width="109" style="fill:rgb(49,0,0)">However, after taking the advice from Martin Honnen (SVG Developers Yahoo! Group) my generated code for the same bar in the graph looks like:
<set attributeName="fill" from="rgb(49,0,0)" to="red" begin="mouseover" end="mouseout" />
</svg:rect>
<svg:rect x="35" y="272.88" height="57.12" width="109" fill="rgb(49,0,0)" onmouseover="evt.target.setAttribute('fill', 'red');" onmouseout="evt.target.setAttribute('fill','rgb(49,0,0)');"/>
The result is that the correct colorings are now displayed when rendered inline in IE, and the mouseover events work correctly in Firefox.The only thing still not working is the mouseover events when rendered inline in IE.
Martin Honnen further suggested to start with a blank SVG placed in the page with the
embed tag, and then access it to manipulate it with the getSVGDocument method (which should work in IE, Firefox 1.5+, and Opera 9) to add the content. However, my attempts at this method have not been successful to date.
IBM's Death Spiral
Robert X. Cringley has a very interesting article on Why IBM is in Trouble.
"[IBM] has entered a death spiral of under-bidding and then under-delivering."
"decades no longer matter to publicly traded American companies. All that really matter are fiscal quarters."
I'm tempted to add my own personal editorial on the subject, but I don't want to put my job in jeopardy.
Wednesday, June 28, 2006
Help with dynamic inline SVG
Normally, I like to post solutions to problems on this blog, but today I'm hoping someone can help me.
In a previous post I presented some methods to embed SVG inline after generating it from XML data. However, there's still a problem, particularly in Internet Explorer, which I discovered when I tried to add some event handling to the SVG. Let me walk through the problem.
First, we start out with some sample XML data like:
<?xml version="1.0" ?>Which I run through my XSLT and get the following SVG (notice the mouseover events):
<SrmData>
<data>
<display_name>srmdb2</display_name>
<date>2006-04-30</date>
<processor_busy>19.04</processor_busy>
</data>
<data>
<display_name>srmxml05</display_name>
<date>2006-04-30</date>
<processor_busy>37.68</processor_busy>
</data>
<data>
<display_name>srmdev1</display_name>
<date>2006-04-30</date>
<processor_busy>26.6</processor_busy>
</data>
<data>
<display_name>srmxml01</display_name>
<date>2006-04-30</date>
<processor_busy>42.74</processor_busy>
</data>
<data>
<display_name>srmweb2</display_name>
<date>2006-04-30</date>
<processor_busy>1.66</processor_busy>
</data>
<data>
<display_name>srmweb1</display_name>
<date>2006-04-30</date>
<processor_busy>5.61</processor_busy>
</data>
<data>
<display_name>srmxml02</display_name>
<date>2006-04-30</date>
<processor_busy>22.74</processor_busy>
</data>
</SrmData>
<svg:svg baseProfile="full" width="850" height="350" xmlns:svg="http://www.w3.org/2000/svg" xmlns="http://www.w3.org/2000/svg" xmlns:xlink="http://www.w3.org/1999/xlink">If I embed the above SVG from a static file (via
<svg:g>
<!--Now Draw the main X and Y axis-->
<svg:g style="stroke-width:3; stroke:black">
<!--X Axis-->
<svg:path d="M 30 330 L 830 330 Z" />
<!--Y Axis-->
<svg:path d="M 30 30 L 30 330 Z" />
</svg:g>
<svg:g style="fill:none; stroke:#B0B0B0; stroke-width:2; stroke-dasharray:2 4;text-anchor:end; font-size:12px; stroke-width:5; stroke:black ">
<!--Add dotted line at 50-->
<svg:path d="M 30 30 L 830 30 Z" />
<svg:path d="M 30 165 L 830165 Z" />
<!--Add Y-axis labels-->
<svg:text style="fill:black; stroke:none" x="20" y="30">
100 </svg:text>
<svg:text style="fill:black; stroke:none" x="20" y="165">
50 </svg:text>
<svg:text style="fill:black; stroke:none" x="20" y="330">
0 </svg:text>
</svg:g>
<svg:rect x="35" y="272.88" height="57.12" width="109" style="fill:rgb(49,0,0)">
<set attributeName="fill" from="rgb(49,0,0)" to="red" begin="mouseover" end="mouseout" />
</svg:rect>
<svg:g>
<svg:text style="fill:black; stroke:none" x="35" y="347" rotate="45" font-size="8">
srmdb2</svg:text>
</svg:g>
<svg:rect x="149" y="216.96" height="113.03999999999999" width="109" style="fill:rgb(96,0,0)">
<set attributeName="fill" from="rgb(96,0,0)" to="red" begin="mouseover" end="mouseout" />
</svg:rect>
<svg:g>
<svg:text style="fill:black; stroke:none" x="149" y="347" rotate="45" font-size="8">
srmxml05</svg:text>
</svg:g>
<svg:rect x="263" y="250.2" height="79.80000000000001" width="109" style="fill:rgb(68,0,0)">
<set attributeName="fill" from="rgb(68,0,0)" to="red" begin="mouseover" end="mouseout" />
</svg:rect>
<svg:g>
<svg:text style="fill:black; stroke:none" x="263" y="347" rotate="45" font-size="8">
srmdev1</svg:text>
</svg:g>
<svg:rect x="377" y="201.78" height="128.22" width="109" style="fill:rgb(109,0,0)">
<set attributeName="fill" from="rgb(109,0,0)" to="red" begin="mouseover" end="mouseout" />
</svg:rect>
<svg:g>
<svg:text style="fill:black; stroke:none" x="377" y="347" rotate="45" font-size="8">
srmxml01</svg:text>
</svg:g>
<svg:rect x="491" y="325.02" height="4.9799999999999995" width="109" style="fill:rgb(4,0,0)">
<set attributeName="fill" from="rgb(4,0,0)" to="red" begin="mouseover" end="mouseout" />
</svg:rect>
<svg:g>
<svg:text style="fill:black; stroke:none" x="491" y="347" rotate="45" font-size="8">
srmweb2</svg:text>
</svg:g>
<svg:rect x="605" y="313.17" height="16.830000000000002" width="109" style="fill:rgb(14,0,0)">
<set attributeName="fill" from="rgb(14,0,0)" to="red" begin="mouseover" end="mouseout" />
</svg:rect>
<svg:g>
<svg:text style="fill:black; stroke:none" x="605" y="347" rotate="45" font-size="8">
srmweb1</svg:text>
</svg:g>
<svg:rect x="719" y="261.78" height="68.22" width="109" style="fill:rgb(58,0,0)">
<set attributeName="fill" from="rgb(58,0,0)" to="red" begin="mouseover" end="mouseout" />
</svg:rect>
<svg:g>
<svg:text style="fill:black; stroke:none" x="719" y="347" rotate="45" font-size="8">
srmxml02</svg:text>
</svg:g>
</svg:g>
</svg:svg>
<embed src="myfile.svg">), it is rendered correctly in IE as: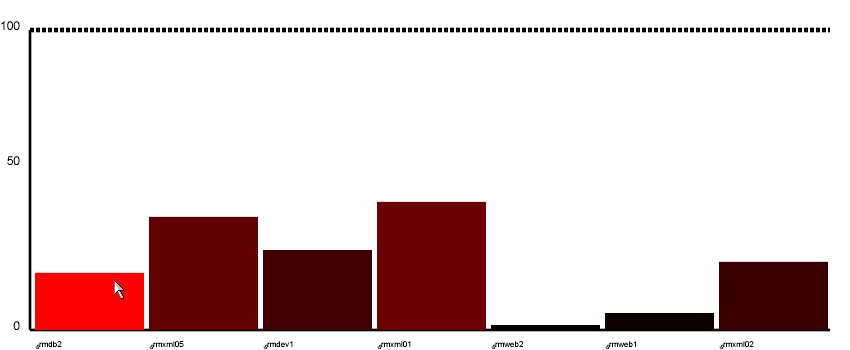 where in the above snapshot, the mouse is over the first bar so the mouseover event has changed it to bright red to highlight it.
The problem is that when it is rendered dynmically inline in Internet Explorer, as described in my previous post, it looks like:
 where there is no coloring and no mouseover events. Both cases require the Adobe SVG Viewer to be installed to render it. So why is it rendered differently?
There is one interesting difference in how IE handles this. When using the
embed tag, if you right click on the image, the pop-up context menu will look like this: where it is obviously using the Adobe SVG Viewer as evidenced by the "About Adobe SVG Viewer..." menu option and other options such as copying, viewing, and saving the SVG. On the other hand, when using the inlined SVG method, the context menu will look like:
 as it would on any other part of the web page. So even though the Adobe plugin rendered the image, it is not apparent.
Meanwhile, on the Firefox side of things, regardless of whether you
embed a static SVG file, put the SVG directly inline (if you're using XHTML), or put it in an object tag, it always looks the same: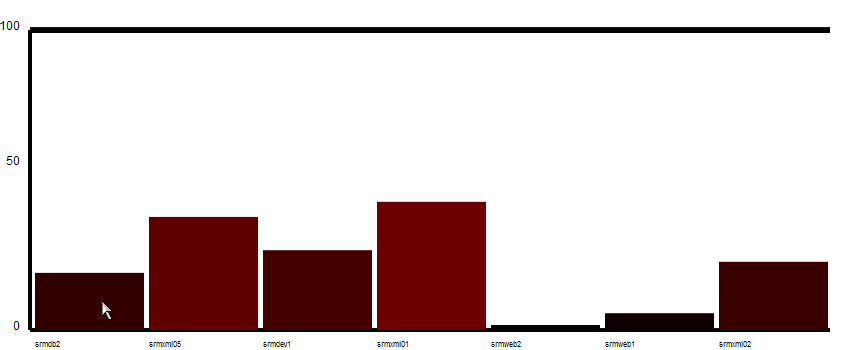 which is good except for the fact that the Firefox (Gecko) SVG rendering engine doesn't seem to support the mouseover events either.
As an alternative method, I tried PlotKit which can generate dynamic SVG graphs and charts. So, I built an HTML table from my XML data and told PlotKit to use that and in both IE and Firefox it worked correctly to give me a graph such as:
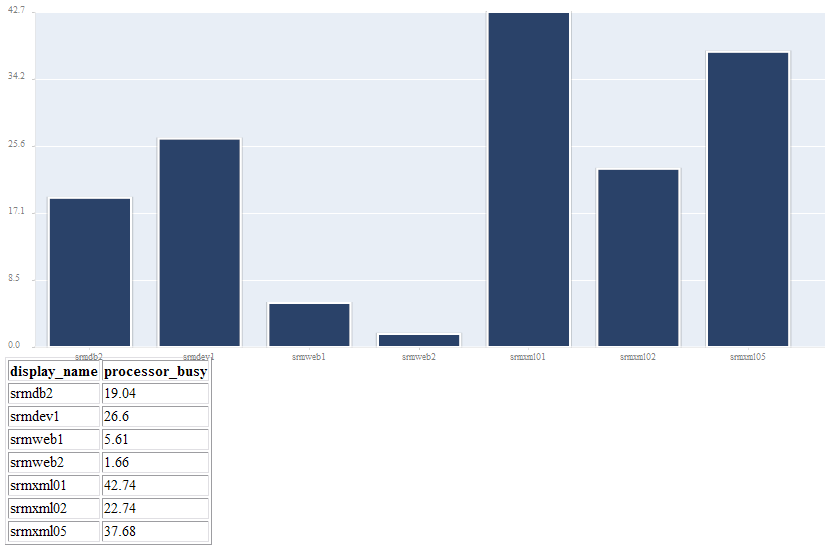 The context menu of this graph is like my inline approach and doesn't acknowledge the Adobe SVG Viewer, however, PlotKit was able to get coloring to work. The current version of PlotKit does not support events which made it both not acceptable for my overall solution as well as provided me no way to test if the mouseover would have worked with the approach used by PlotKit. However, since at least colors worked, I started investigating how he (Alastair Tse) was able to render the dynamic inline SVG in IE.
I found this note in one of his samples:
Note: With SVG, the most compatible way is NOT to put in SVG tags, but create the SVG element with Javascript. Therefore, instead of adding
<svg> tag, we just have a <div> container and create the SVG element using SVGRenderer.SVG().And looking at the PlotKit code I can see that his library is dynamically building the SVG using JavaScript DOM APIs to add each element.
Well, since I want to use XSLT to generate my SVG from XML and not write my own version of the PlotKit library to build my SVGs, I tried a hybrid approach. I used the DOM APIs to create a temporary DOM element. I assigned my generated SVG to that element's innerHTML in order to have the browser build a DOM tree out of my SVG. I then created an
svg DOM element, and appended the first child DOM element of my SVG DOM (the first g element) to the svg DOM element and appened the svg DOM element to the document. Which I would think would be theoretically the same thing, but to no avail.Does anyone out there know how to fix this? How can I make Internet Explorer render my dynamic inline SVG correctly in order to get proper coloring and event handling?
Update: See follow-up